Wilayah karibia pernah memiliki fauna mamalia darat beragam jenis yang mengandung 120 spesies, tetapi saat ini spesies tersebut hampir punah yang diperkirakan masih bertahan hidup sekitar 15 spesies saja.
Dua spesies hampir punah bahkan terancam punah masuk ke daftar merah spesies terancam IUCN. Spesies tersebut seperti Hispaniolan solenodon Solenodon paradoxus dan Hispaniolan hutia Plagiodontia aedium.
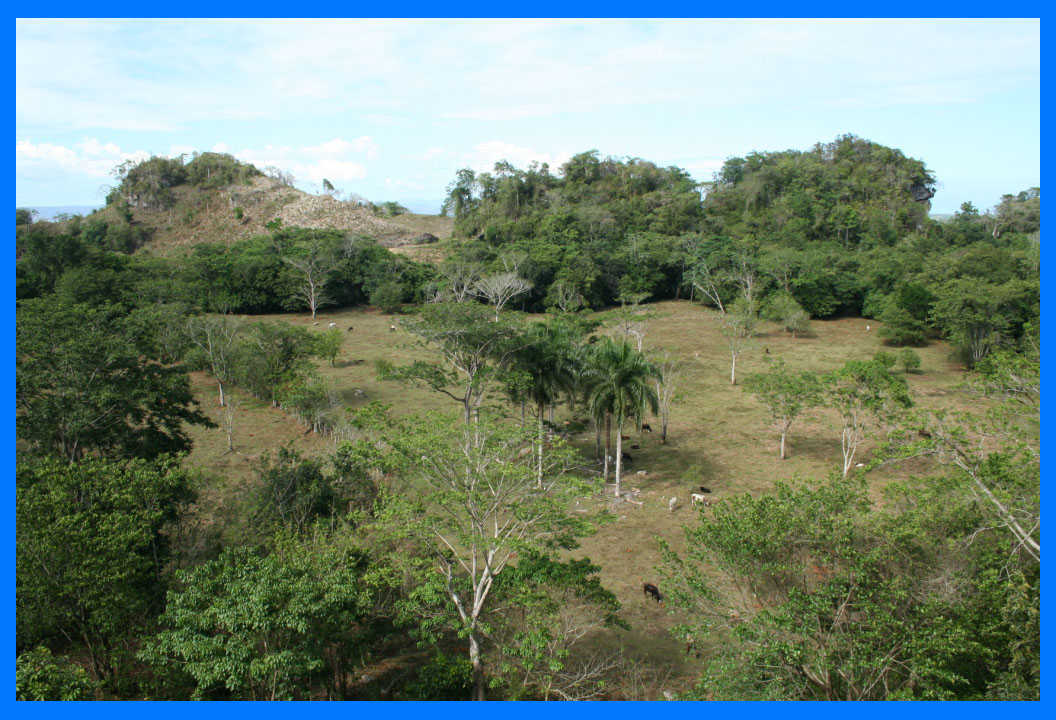
Selama beberapa abad yang lalu, kedua spesies endemik ini dianggap sangat langka dan terkadang dianggap punah oleh masyarakat sekitar. Penghuni berbagai jenis hutan di Republik Dominika dan sebagian kecil dari Haiti yaitu Hispaniolan solenodon, Hispaniolan hutia, tikus besar di pohon arboreal, dan solenodon, mamalia seperti tikus besar pemakan serangga.
Solenodon Hispaniolan mempunyai status yang terancam punah secara global yang dianggap sebagai salah satu spesies mamalia prioritas utama di dunia untuk konservasi oleh EDGE (Evolutionarily Distinct and Globally Endangered).
Hampir jarang diketahui tentang status dan sejarah kedua spesies ini. Nampaknya keduanya memiliki spesies yang menurun karena lingkungan tempat tinggal mereka terus terdegradasi dari aktivitas manusia seperti pertanian, pembakaran, pembukaan lahan untu perkotaan.
Namun, dengan tidak adanya informasi secara detail tentang ekologi dasar mereka, mustahil untuk merancang sebuah tindakan konservasi dan mengevaluasi keberhasilan upaya pengelolaan apapun.
Pada awal tahun 2009, kolaborasi antara mitraINggris dan Dominika menerima hibah Darwin Initiative dari pihak Inggris untuk menjalankan proyek tiga tahun di Republik Dominika.
Gabungan antara kedua pihak ini digunakan untuk membangun kapasitas pendukung yang digunakan untuk membuar rencana konservasi spesies – spesies langka ini.
Di negara Republik Dominika, proyek ini lebih dikenar sebagai “Los Ultimos Sobrevivientes – salvando el Solenodonte y la Hutia de la Hispaniola” yang kalau diterjemahkan adalah “Korban Terakhir – Menyelamatkan Solenodon dan Hutia Hispaniolan”.
Judul yang dirancang untuk menekankan proyek pun sangat menarik yaitu Sebelum manusia tiba di Hispaniola, ada sekitar 25 spesies mamalia darat yang tinggal di pulau itu. Pada akhirnya, kedatangan orang Eropa beberapa ratus tahun yang lalu membuat spesies mereka menurun, dan hanya tersisa Solenodon dan Hutia saja yang sampai hari ini masih bertahan hidup.
Dalam jangka panjang, kami memiliki tujuan untuk memperluas fokus kami kepada para hewan terakhir lainnya di Karibia. Hal ini memungkinkan kebutuhan konservasi jangka panjang dari hewan pengerat agar mudah dipahami dan diimplementasikan serta untuk membangun kapasitas ilmu konservasi di wilayah Karibia supaya bisa upaya berkelanjutan di masa yang akan datang.